Observability with OpenTelemetry
This page explains how to achieve observability through database query tracing and metrics collection by integrating ldbc with OpenTelemetry.
For detailed API references (span attribute list, TelemetryConfig, metrics specification, etc.), see the Telemetry Reference.
Required Dependencies
Add the following dependencies to your project to use OpenTelemetry with ldbc:
libraryDependencies ++= Seq(
  // ldbc connector (includes otel4s-core)
  "io.github.takapi327" %% "ldbc-connector" % "0.7.0",

  // otel4s library (Scala wrapper for OpenTelemetry)
  "org.typelevel"    %% "otel4s-oteljava"                           % "0.15.1",

  // OpenTelemetry exporter (for data transmission)
  "io.opentelemetry"  % "opentelemetry-exporter-otlp"               % "1.59.0" % Runtime,

  // Auto-configuration (configuration via environment variables and system properties)
  "io.opentelemetry"  % "opentelemetry-sdk-extension-autoconfigure" % "1.59.0" % Runtime,
)Basic Setup
Configure both setTracer and setMeter on MySQLDataSource to enable tracing and metrics collection.
import cats.effect.*
import io.opentelemetry.api.GlobalOpenTelemetry
import org.typelevel.otel4s.oteljava.OtelJava
import ldbc.connector.*
import ldbc.dsl.*

val serviceName = "my-ldbc-app"

val resource: Resource[IO, Connector[IO]] =
  for
    otel   <- Resource
                .eval(IO.delay(GlobalOpenTelemetry.get))
                .evalMap(OtelJava.forAsync[IO])
    tracer <- Resource.eval(otel.tracerProvider.get(serviceName))
    meter  <- Resource.eval(otel.meterProvider.get(serviceName))
    datasource = MySQLDataSource
                   .build[IO]("localhost", 3306, "user")
                   .setPassword("password")
                   .setDatabase("mydb")
                   .setSSL(SSL.Trusted)
                   .setTracer(tracer)
                   .setMeter(meter)
  yield Connector.fromDataSource(datasource)

val program = resource.use { connector =>
  sql"SELECT * FROM users".query[String].to[List].readOnly(connector)
}
You can also use tracing-only or metrics-only:
// Tracing only
val tracingOnly = MySQLDataSource.build[IO]("localhost", 3306, "user")
  .setTracer(tracer)

// Metrics only
val metricsOnly = MySQLDataSource.build[IO]("localhost", 3306, "user")
.setMeter(meter)Connection Pool with Metrics
When using connection pooling, pass meter to the pooling method to automatically collect pool metrics (connection wait time, use time, timeout count, etc.).
import ldbc.connector.*

val pool = MySQLDataSource.pooling[IO](
  config = MySQLConfig.default
    .setHost("127.0.0.1")
    .setPort(3306)
    .setUser("user")
    .setPassword("password")
    .setDatabase("mydb"),
  meter  = Some(meter),
  tracer = Some(tracer)
)
For the full list of pool metrics, see Telemetry Reference - Connection Pool Metrics.
Customization with TelemetryConfig
Use TelemetryConfig to control telemetry behavior.
import ldbc.connector.telemetry.TelemetryConfig

// Default (spec-compliant, all features enabled)
val config = TelemetryConfig.default

// Use fixed span names (no query text parsing)
val fixedSpanName = TelemetryConfig.withoutQueryTextExtraction

// Custom configuration
val custom = TelemetryConfig.default
  .withoutQueryTextExtraction    // Use fixed span names like "Execute Statement"
  .withoutSanitization           // Disable query sanitization (caution: may expose sensitive data)
  .withoutInClauseCollapsing     // Do not collapse IN (?, ?, ?) to IN (?)
Apply TelemetryConfig to the data source:
val datasource = MySQLDataSource
  .build[IO]("localhost", 3306, "user")
  .setPassword("password")
  .setDatabase("mydb")
  .setTracer(tracer)
  .setMeter(meter)
.setTelemetryConfig(TelemetryConfig.withoutQueryTextExtraction)Practical Example: Jaeger + Prometheus + Grafana
A complete example of building an observability environment with Docker Compose (Jaeger, Prometheus, Grafana) and sending traces and metrics from an ldbc application.
Project Structure
otel-example/
├── src/
│   └── main/
│       └── scala/
│           └── Main.scala
├── database/
│   └── init.sql
├── dependencies/
│   ├── jaeger/
│   │   └── jaeger-ui.json
│   ├── prometheus/
│   │   └── prometheus.yml
│   └── grafana/
│       └── datasources.yaml
└── docker-compose.yamlMain.scala
import cats.effect.*
import io.opentelemetry.api.GlobalOpenTelemetry
import org.typelevel.otel4s.oteljava.OtelJava
import ldbc.connector.*
import ldbc.dsl.*

object Main extends IOApp.Simple:

  private val serviceName = "ldbc-otel-example"

  private def setupObservability: Resource[IO, Connector[IO]] =
    for
      otel   <- Resource
                  .eval(IO.delay(GlobalOpenTelemetry.get))
                  .evalMap(OtelJava.forAsync[IO])
      tracer <- Resource.eval(otel.tracerProvider.get(serviceName))
      meter  <- Resource.eval(otel.meterProvider.get(serviceName))
      datasource = MySQLDataSource
                     .build[IO]("127.0.0.1", 13306, "ldbc")
                     .setPassword("password")
                     .setDatabase("world")
                     .setSSL(SSL.Trusted)
                     .setTracer(tracer)
                     .setMeter(meter)
    yield Connector.fromDataSource(datasource)

  override def run: IO[Unit] =
    setupObservability.use { connector =>
      sql"SELECT name FROM city".query[String].to[List].readOnly(connector).flatMap { cities =>
        IO.println(cities)
      }
}docker-compose.yaml
services:
  database:
    image: mysql:9.6.0
    container_name: ldbc-otel-example
    ports:
      - 13306:3306
    networks:
      - static-network
    volumes:
      - ./database:/docker-entrypoint-initdb.d
    environment:
      MYSQL_USER: 'ldbc'
      MYSQL_PASSWORD: 'password'
      MYSQL_ROOT_PASSWORD: 'root'
      TZ: 'Asia/Tokyo'
    healthcheck:
      test: [ "CMD", "mysqladmin", "ping", "-h", "localhost" ]
      timeout: 20s
      retries: 10

  prometheus:
    image: prom/prometheus:latest
    volumes:
      - "./dependencies/prometheus/prometheus.yml:/etc/prometheus/prometheus.yml"
    ports:
      - "9090:9090"
    networks:
      - static-network

  jaeger:
    image: jaegertracing/all-in-one:latest
    volumes:
      - "./dependencies/jaeger/jaeger-ui.json:/etc/jaeger/jaeger-ui.json"
    command: --query.ui-config /etc/jaeger/jaeger-ui.json
    environment:
      - METRICS_STORAGE_TYPE=prometheus
      - PROMETHEUS_SERVER_URL=http://prometheus:9090
      - COLLECTOR_OTLP_ENABLED=true
    ports:
      - "16685:16685" # GRPC
      - "16686:16686" # UI
      - "4317:4317"   # OTLP gRPC receiver
      - "4318:4318"   # OTLP HTTP receiver
    networks:
      - static-network

  grafana:
    image: grafana/grafana-oss
    restart: unless-stopped
    volumes:
      - "./dependencies/grafana/datasources.yaml:/etc/grafana/provisioning/datasources/datasources.yaml"
    ports:
      - "3000:3000"
    networks:
      - static-network
    depends_on:
      jaeger:
        condition: service_started

networks:
  static-network:
name: static-networkExecution Steps
- Start the observability environment with Docker Compose:
cd otel-example
docker-compose up -d- Run the application with the following Java options:
sbt -Dotel.java.global-autoconfigure.enabled=true \
    -Dotel.service.name=ldbc-otel-example \
    -Dotel.traces.exporter=otlp \
    -Dotel.metrics.exporter=otlp \
    -Dotel.exporter.otlp.endpoint=http://localhost:4317 \
    run
For build.sbt configuration:
javaOptions ++= Seq(
  "-Dotel.java.global-autoconfigure.enabled=true",
  "-Dotel.service.name=ldbc-otel-example",
  "-Dotel.traces.exporter=otlp",
  "-Dotel.metrics.exporter=otlp",
  "-Dotel.exporter.otlp.endpoint=http://localhost:4317"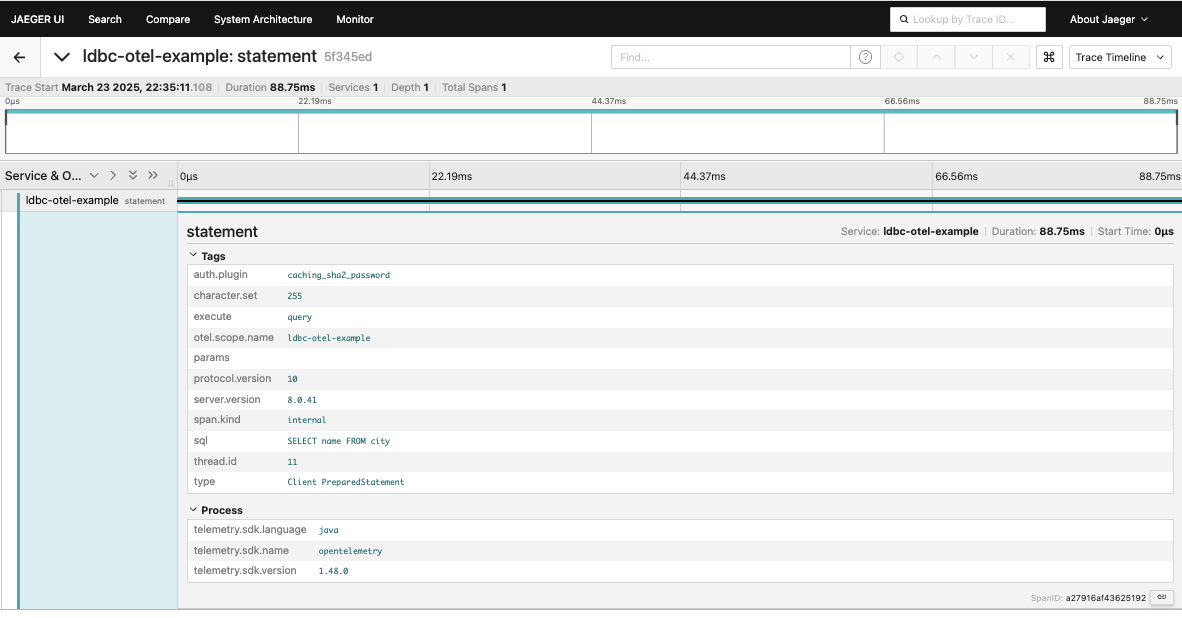
)- After running the application, access the Jaeger UI (http://localhost:16686) to view traces:
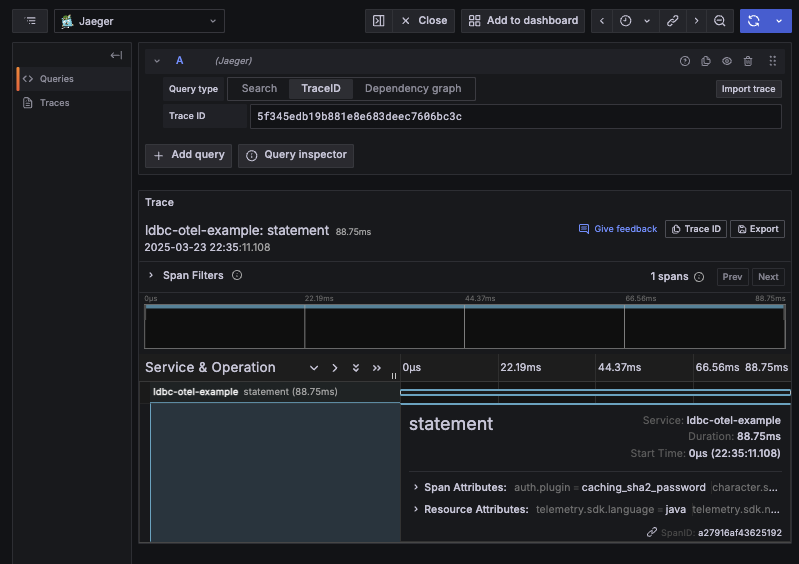
You can also check traces and metrics in the Grafana UI (http://localhost:3000):
Summary
Combining ldbc with OpenTelemetry enables detailed visualization and monitoring of database operations.
- Tracing: Record query execution time, error details, and span attributes via
setTracer - Metrics: Record query duration, returned row counts, and pool state via
setMeter - TelemetryConfig: Customize query sanitization and span name generation behavior
For detailed span attributes and metrics specifications, see the Telemetry Reference.